> ## Documentation Index
> Fetch the complete documentation index at: https://docs.qu.ai/llms.txt
> Use this file to discover all available pages before exploring further.
# Node Monitoring
> Monitor the performance of your Quai Network Node.
## Introduction
Monitoring your node's performance in real time allows you to ensure that it is running smoothly and efficiently. The go-quai client bundles a monitoring solution that allows you to track the health and performance of your node. This guide will walk you through setting up Grafana and Prometheus to monitor your node.
## Prerequisites
| | |
| ------------------------------------------------- | ------------------------------------------------- |
| [Quai Network Node](/participate/node/run-a-node) | A Quai Network node to enable monitoring for. |
| [Grafana](https://grafana.com/) | An open-source analytics and monitoring solution. |
| [Prometheus](https://prometheus.io/) | An open-source monitoring and alerting toolkit. |
## Install Dependencies
If you are configuring monitoring for an external node, you will need to forward the Prometheus and Grafana ports to your local machine.
Grafana runs on **port 3000**, and Prometheus runs on **port 9090** by default.
### Prometheus
Installing Prometheus can be done from the command line using your favorite package manager. Run the following command to install Prometheus on a Linux machine:
```bash theme={null}
sudo apt install prometheus -y
```
On first install, it can be useful to enable the Prometheus service to start on boot. This will prevent you from having to manually start the service every time you reboot your machine. To enable the Prometheus service, run the following command:
```bash theme={null}
sudo systemctl enable prometheus
```
### Grafana
You can install Grafana by following the instructions on the [official Grafana download page](https://grafana.com/grafana/download?edition=oss).
For example, on Ubuntu, you can install Grafana using the following commands:
```bash theme={null}
sudo apt-get install -y adduser libfontconfig1 musl
wget https://dl.grafana.com/oss/release/grafana_10.4.2_amd64.deb
sudo dpkg -i grafana_10.4.2_amd64.deb
```
## Configuration
Prometheus requires a configuration file to scrape metrics from your node. `go-quai` has a pre-configured Prometheus configuration file that you can use. To use this configuration file, run the following command:
```bash theme={null}
# navigate to the go-quai directory
cd go-quai
# copy the configuration file
sudo cp metrics_config/prometheus.yml /etc/prometheus/
```
You only need to copy the configuration file once. If you have already copied the file, you do not need to run the command again.
## Initialize Node Monitoring
To start monitoring your node, you'll need to ensure that both Prometheus and Grafana are running. You can start both services using the following commands:
```bash theme={null}
sudo systemctl start prometheus
sudo systemctl start grafana-server.service
```
Once both services are running, you'll need to start your Quai Network node with the `--metrics.enabled` flag. This will enable Prometheus to scrape metrics from your node. To start your node with the `--metrics.enabled` flag, run your normal node startup command with the metrics flag added to it:
```bash theme={null}
# start your node with the added metrics flag
./build/bin/go-quai start <--startup-flags> --metrics.enabled
```
If you're not familiar with other go-quai startup flags, refer to the [Run a Node](/guides/client/node#environment-variables) guide.
### Access Grafana
To access Grafana, open your web browser and navigate to `http://localhost:3000`. You will be prompted to log in. The default username and password are both `admin`.
If you are monitoring a local machine, you may keep the default password and username or change them. **If you are monitoring an external
node, i.e. you have forwarded your ports, it is highly recommended to change the default password and username**.
### Add Prometheus to Grafana
Once you have logged into Grafana, we need to add Prometheus as a data source. To do this, follow these steps:
Click on `Connections` in the left-hand menu.
In the connections menu, Click on `Add new connection`.
Select `Prometheus` from the list of data sources. You may need to search for it.
Click on `Add new data source` in the upper right. This will take you to a settings tab where you can configure Prometheus.
In the `Connection` section of the settings tab, enter the following URL:
* `http://localhost:9090` if you're monitoring a local machine
* `http://EXTERNALIPADDRESS:9090` if you are monitoring an external node
After adding Prometheus as a data source, we can create a dashboard to monitor our node. To do this, follow these steps:
Click on `Dashboards` in the left-hand menu.
Click the `New` button.
Click the `Import` button.
Paste the configuration file located in `metrics_config/grafana_metrics.json` into the text box. You can find the configuration file
[here](https://github.com/dominant-strategies/go-quai/blob/main/metrics_config/grafana_metrics.json)
### Monitor Your Node
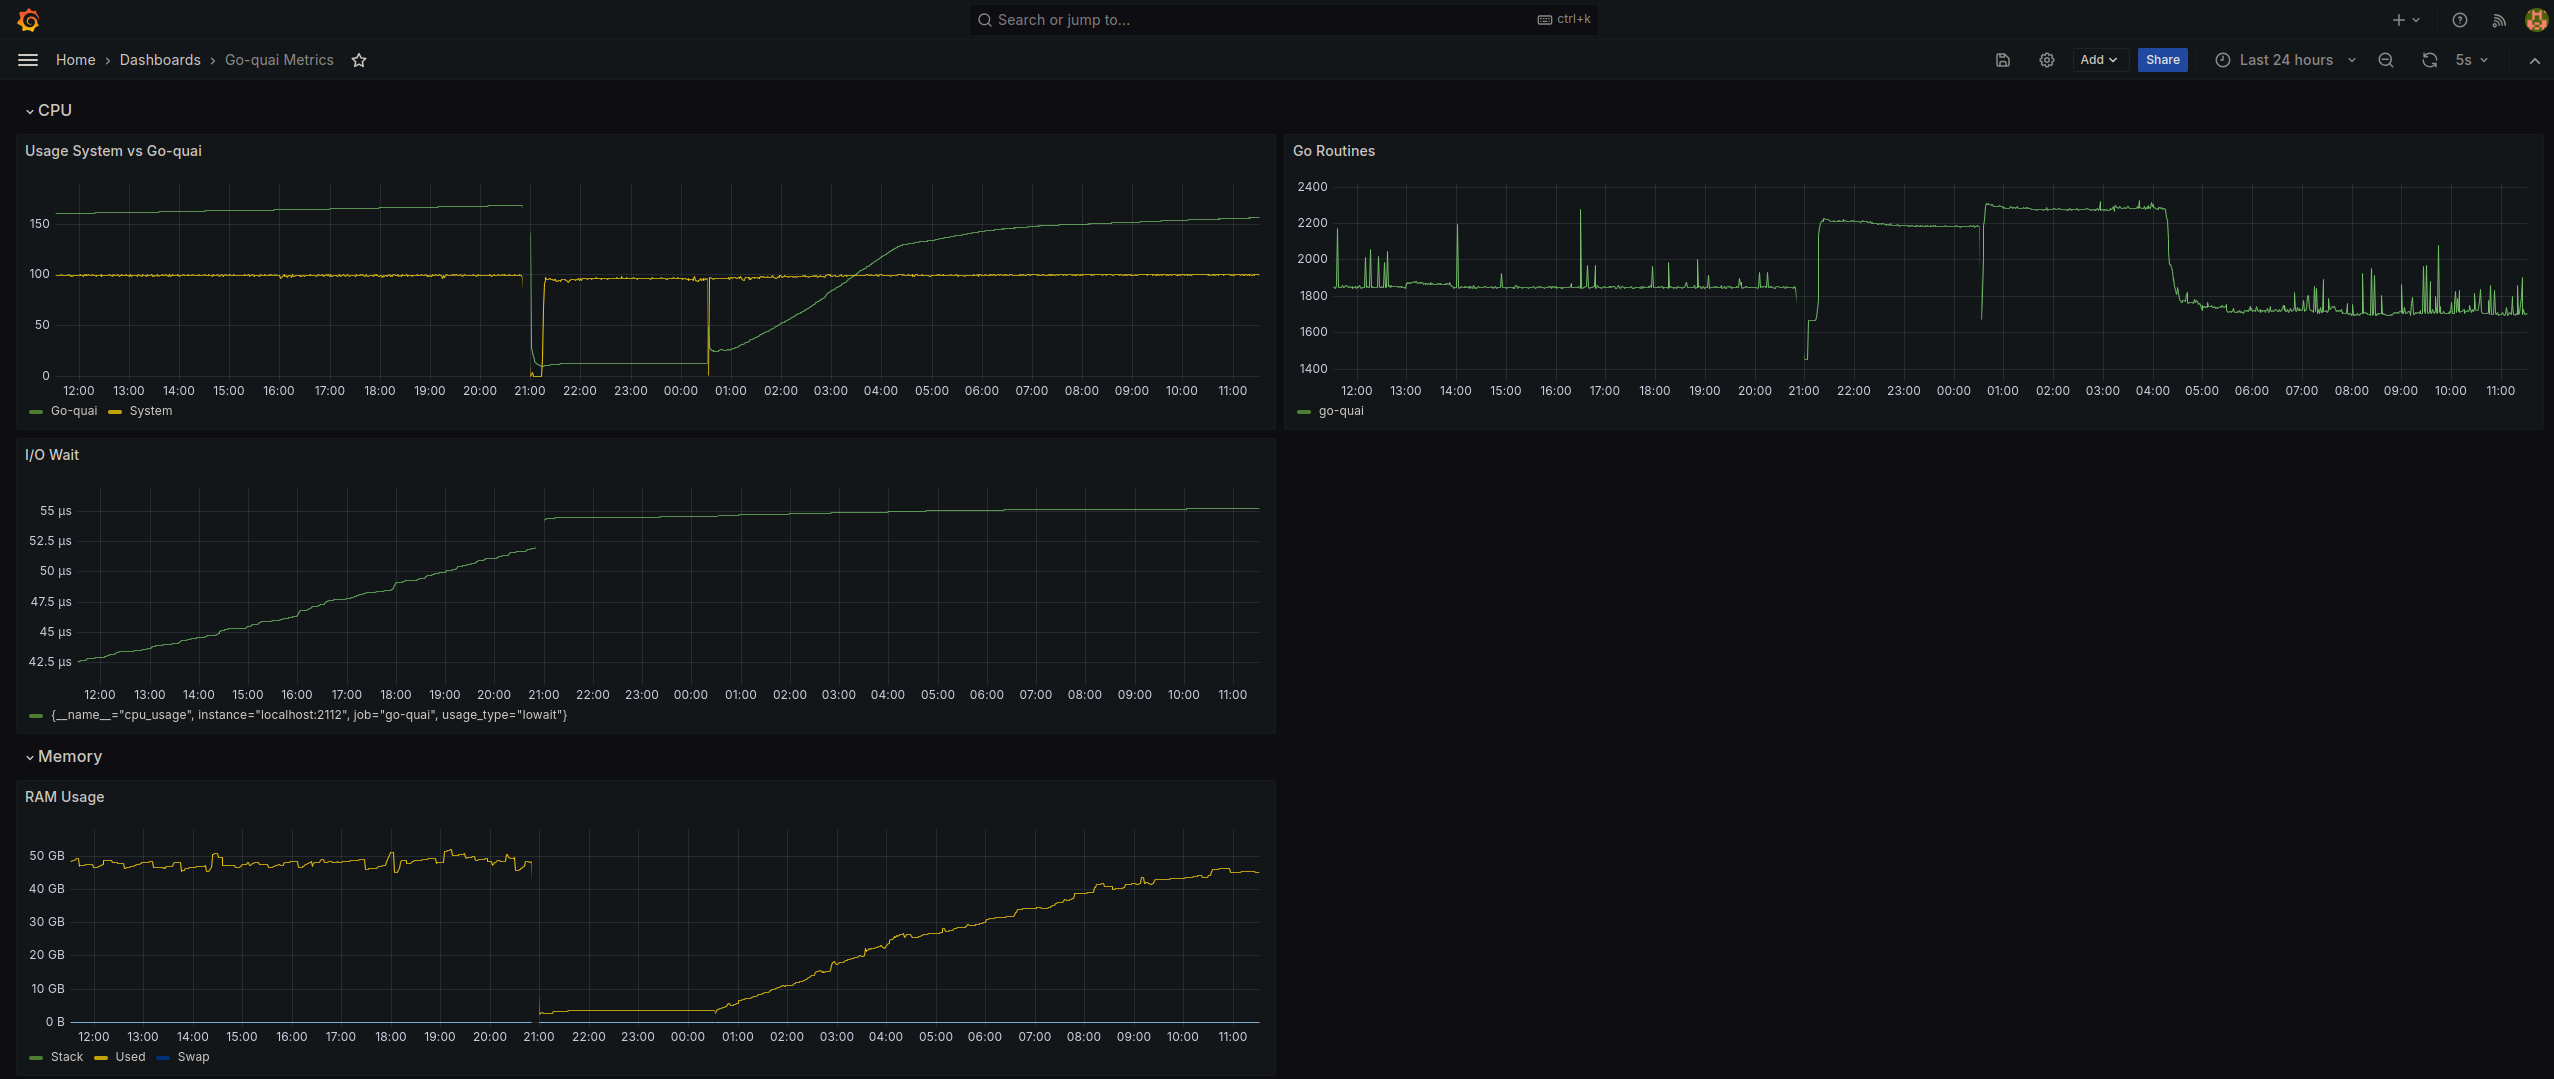
After setting the data source and importing the configuration file, you should see a dashboard similar to the one below that displays the health and performance of your node. **Your node is now being monitored in real time.**